
Servers are currently playing the most important role in processing requests and delivering uninterrupted internet exploring experience to the end users. It is fully responsible for uploading and downloading of data at a constant speed. That is why; one must monitor the server regarding its procession, disk usage and CPU usage etc. It is a very important process to understand the system resource usage through server for providing better experience to end user. To make it work, various server monitoring tools are available on internet for free of cost. These tools are capable enough to monitor the health of server and detect as if there is any kind of changes need to perform.
Lots of challenges occur while monitoring the server, that is why some tools are specifically designed to simplify the task. One of the most challenging tasks is to manage the rapidly increasing servers with limited number of resources. The server monitoring tools designed by developers are very easy to use and helpful in providing crucial information. These tools vary on the basis of operating systems on which the servers are running, so it is very important to choose a suitable tool before downloading it. To make it simple, some of them are listed below with brief description:-
7 Best Free Server Monitoring Tools:
-
Munin monitors:
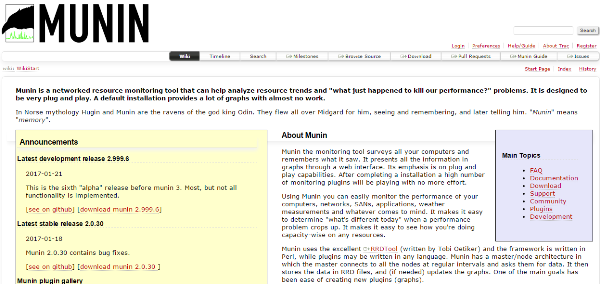
This is multi-functioning tools that you can use for system monitoring, network monitoring, and infrastructure monitoring software application. This tool is based on open source applications and is free of cost. The name Munin signifies “memory”, as the name indicates it make surveys of all computers and find out the problems or information. With the help of web interface, it represents the information in the form of graphs. As, this multi-functional device is used to monitor the performances like computers, SANs, networks, applications and weather measurements.
Munin works with the help of PRD Tool, which updates the graphs used in plugins. Munin 2.0 is available for following Linux distributions such as Fedora,Debian, Mandriva, Ubuntu, Red Hat Enterprise Linux, and Gentoo, FreeBSD ports.
Perl is the writing language for core plugins of Munin core . Master Munin requires 5.1 or advanced version, alternative methods to run Munin are:
- Munin-node-C
- Munin Node in python
- Munin-node for Open WRT
- Munin-node for shell script
-
Monit:
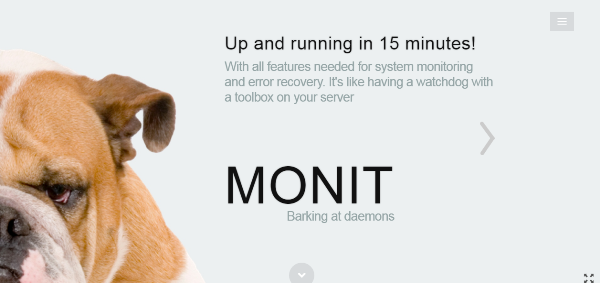
These monitoring tools try to solve the problem by its predefined actions. Monit is free Open Source service for monitoring Unix systems. It automatically conducts the problem and maintains or repair them so that you can execute it by error free situations. To monitor more than one server one can use the extensions of Monit or M/Monit. This also monitors the daemon processors along with files and directories. This takes actions in few minutes to solve the error of current problem. You may consider it as best server monitoring tools among others.
-
Nagios:
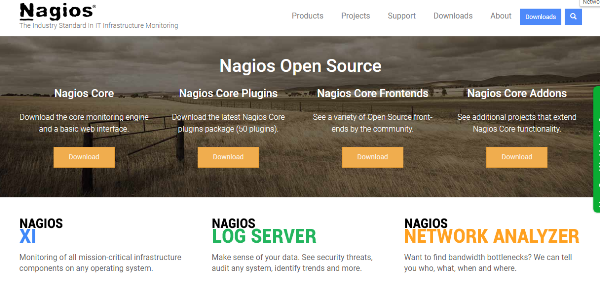
Large organizations use this tool for various operational activities such as in IT Infrastructure Monitoring And Alerting. It solves the problems like overloading of data links, network connections and other issues or routers and switches. Without any effect in business organizations, it solves the critical situations. You can explain the working of this tool with the help of network analyzer, network monitoring software, and network traffic monitoring. This is recommended as the best server monitoring tools to run large scale organizations.
With the help of certain software, one can get the sufficient knowledge about it. Like by Server Monitoring Software, Windows Server Monitoring and Linux Server Monitoring one can understand the working of Nagios. The process of installation and configuration has little bit complications. In a large number of IT network administration, this monitoring server provides support. As there are multiple hosts present in networking of organizations, so Nagios alerts through e-mails, messages, and pager system.
-
Ganglia:
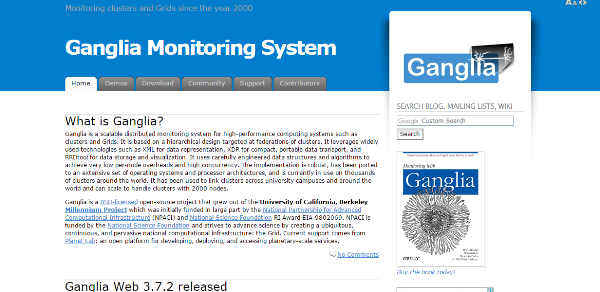
It is an open source application based on the BSD-licensed system. Ganglia is designed for high-performance computing systems. It depends upon the technologies like XML for data representation, portable data transport, XDR for compact and RRD tool for data storage and visualization process. This is used for high performances computing systems like clusters ad grids. The release date of Ganglia Web 3.7.2 was June 14, 2016, Certain changes comes in this such as it fixes for XSS issue in the metrics API. The main function of server monitoring tools is to monitor the issues. Thus one can use Ganglia for monitoring as well as it performs multiple functions such as detecting changes, provide information about changes and take suitable actions according to it.
5. Cacti:
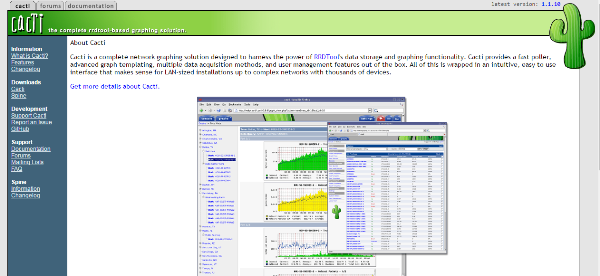
This tool performs same functions as like Munin. The only difference between two of them is it allows you resize the graphs and view data in an arbitrary range. Munin performs on the basis of weekly, monthly and yearly graphs whereas a cactus provides you every single information like data of last 3 hours, 6 hours or 2 hours. One can easily view the information by resizing it according to a comfortable zone. The actions of cacti depends upon the user information. It views the data according to the permission of clients. This is mainly used for the front end graphic system. Its data handling capability is recommendable.
6. Observium:
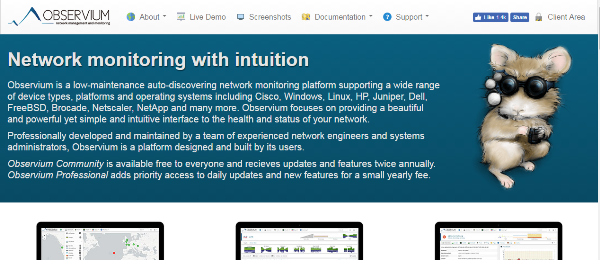
This is defined a low-maintenance server monitoring tools. This is compatible with Windows, HP, Dell, Linux, Net App, BSD, Cisco and other networks. This tool provides supports for a huge range of network devices and operating systems. It supports both the standards and private MIBs. This is also used to provide support for auto-detection and graphing of devices. Thus the various other systems which depend upon Observium are Alcatel AIP, Cisco CDP, Foundry FDP and LLDP discovery protocols, vendor-specific extensions to BGP4-MIB from Cisco, Force 10 and Juniper, vendor-specific MAC.
-
Collected:
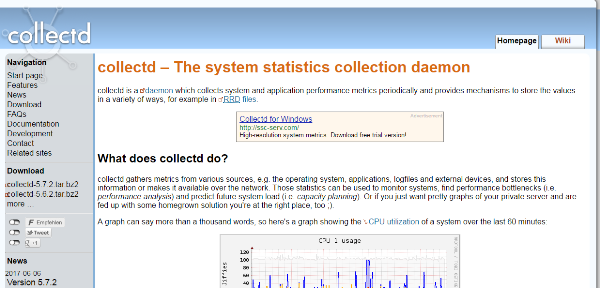
Its main focus is in graphics and the metric system. Therefore it collects graphics and metrics from various sources like log files, operating system, and several external devices. It does not generate the graphs but can only write in RRD files. In its 4.3 version monitoring facility is added to make it more advanced. Without any interference in the server process, it gathers the whole information or data after every 10-15 seconds. In C, Pearl and JAVA one has to write the extensions.